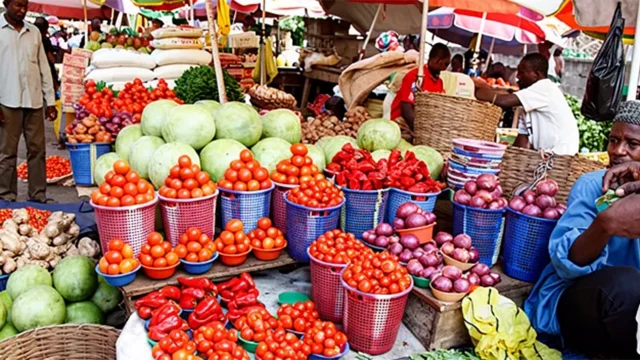
Inflation: Food Prices Bite Harder in Lagos, Abia, Oyo as Plateau Records Lowest Nigeria Food Prices and Inflation: NBS Data Before September Report

Nigeria’s latest available official inflation figures show slower price growth, but the National Bureau of Statistics (NBS) has not yet listed September 2026 inflation or food-price reports in the public catalogues examined by The Bureau Journal on October 6.
The latest listed Consumer Price Index report covers August 2026 and was released on September 15. The latest listed Selected Food Price Watch covers May 2026. These reports measure different periods and cannot establish what Nigerians paid for food in September.
An examination of the official reports nevertheless shows an important distinction: inflation can decline while prices continue rising. It also shows that some foods became cheaper than a year earlier while becoming more expensive than the previous month.
Food item and unit May 2025 April 2026 May 2026 Monthly change Annual change
Fresh tomatoes, 1kg ₦1,392.71 ₦1,177.92 ₦1,560.56 +32.48% +12.05%
Brown beans, 1kg ₦2,385.15 ₦1,338.93 ₦1,344.93 +0.45% -43.61%
White beans, 1kg ₦2,040.51 ₦1,291.33 ₦1,297.18 +0.45% -36.43%
White garri, 1kg ₦1,341.79 ₦808.96 ₦813.24 +0.53% -39.39%
Yellow garri, 1kg ₦1,438.26 ₦861.92 ₦865.41 +0.40% -39.83%
Fresh onions, 1kg ₦1,607.38 ₦1,164.39 ₦1,180.01 +1.34% -26.59%
Fresh ginger, 1kg ₦5,505.77 ₦5,581.82 ₦5,906.82 +5.82% +7.28%
Local short-grain rice, 1kg ₦2,095.29 ₦1,893.44 ₦1,905.43 +0.63% -9.06%
Imported long-grain rice, 1kg ₦2,604.69 ₦2,233.71 ₦2,245.70 +0.54% -13.78%
Broken local rice, 1kg ₦2,576.60 ₦2,195.78 ₦2,208.08 +0.56% -14.30%
White maize grain, 1kg ₦1,216.55 ₦811.33 ₦815.83 +0.55% -32.94%
Yam tuber, 1kg ₦2,375.40 ₦2,218.46 ₦2,347.09 +5.80% -1.19%
Eggs, crate of 30 ₦6,263.92 ₦6,143.11 ₦6,149.18 +0.10% -1.83%
Sliced bread, 450g ₦1,657.59 ₦1,682.60 ₦1,687.18 +0.27% +1.79%
Groundnut oil, 75cl ₦3,215.27 ₦3,104.30 ₦3,113.05 +0.28% -3.18%
Palm oil, 75cl ₦2,475.08 ₦2,396.32 ₦2,396.62 +0.01% -3.17%
Source: NBS Selected Food Price Watch, May 2026, national comparison table on printed page 16 and the accompanying Excel worksheet. Prices and percentage changes are rounded to two decimal places. Download the official PDF and Excel package.
Why cheaper annual prices can still mean a rising shopping bill
Brown beans illustrate the difference between annual and monthly comparisons. Their average price fell from ₦2,385.15 in May 2025 to ₦1,344.93 in May 2026, but rose from ₦1,338.93 in April 2026.
White garri followed the same pattern: substantially cheaper than a year earlier, but slightly more expensive than the previous month.
Tomatoes moved differently. Their average price increased both annually and monthly, with the monthly rise of 32.48% far exceeding the increases recorded for most staples in the table.
The figures show why household experiences can differ. A family buying more tomatoes and ginger could face a sharper increase than one whose purchases are concentrated on products recording smaller changes.
Food prices varied considerably across states
The May report also shows that national averages conceal substantial geographic differences.
Food item, 1kg Highest state average Lowest state average Price difference
Tomatoes Lagos: ₦1,974.81 Ekiti: ₦1,017.00 ₦957.81
Brown beans Oyo: ₦1,941.78 Taraba: ₦760.00 ₦1,181.78
White garri Abia: ₦1,075.71 Plateau: ₦521.10 ₦554.61
Onions Abia: ₦2,199.07 Nasarawa: ₦850.00 ₦1,349.07
Source: NBS May 2026 Food Price Watch, printed page 3. Price differences calculated by The Bureau Journal from the published averages.
These are average prices for particular products, not a ranking of the overall cost of living in those states. Likewise, a state’s inflation rate measures price changes rather than the absolute cost of a shopping basket.
How to read the evidence
The NBS distinguishes annual inflation, which compares a month with the same month a year earlier, from monthly inflation, which compares it with the preceding month.
Its rebased CPI uses 2023 household expenditure weights and a 2024 price reference period. The basket contains 242 item strata and covers urban and rural locations across the 36 states and the Federal Capital Territory.
The Food Price Watch methodology describes collection across the 774 local government areas, involving about 10,000 respondents and locations, with verification checks on recorded prices.
National food-price averages should therefore be treated as statistical benchmarks.
Comments